User Guide
Alerting
In this documentation, we'll cover how to set up alerting using Netchecks, Kyverno Policy Reporter, Prometheus, and Grafana.
Prerequisites
Before proceeding, make sure you have installed the following components:
- Netchecks operator
- Kyverno Policy Reporter (optionally installed alongside Netchecks)
- Prometheus
- Grafana
Configure Alerting Rules in Prometheus
Prometheus allows you to define custom alerting rules based on specific metrics. These rules trigger alerts when certain conditions are met. To create alerting rules for the Policy Reporter metrics, you'll need to create a PrometheusRule object in your Kubernetes cluster.
Create a file called netchecks-alerts.yaml and add the following content:
apiVersion: monitoring.coreos.com/v1
kind: PrometheusRule
metadata:
name: netchecks-alerts
namespace: default
spec:
groups:
- name: Netcheck
rules:
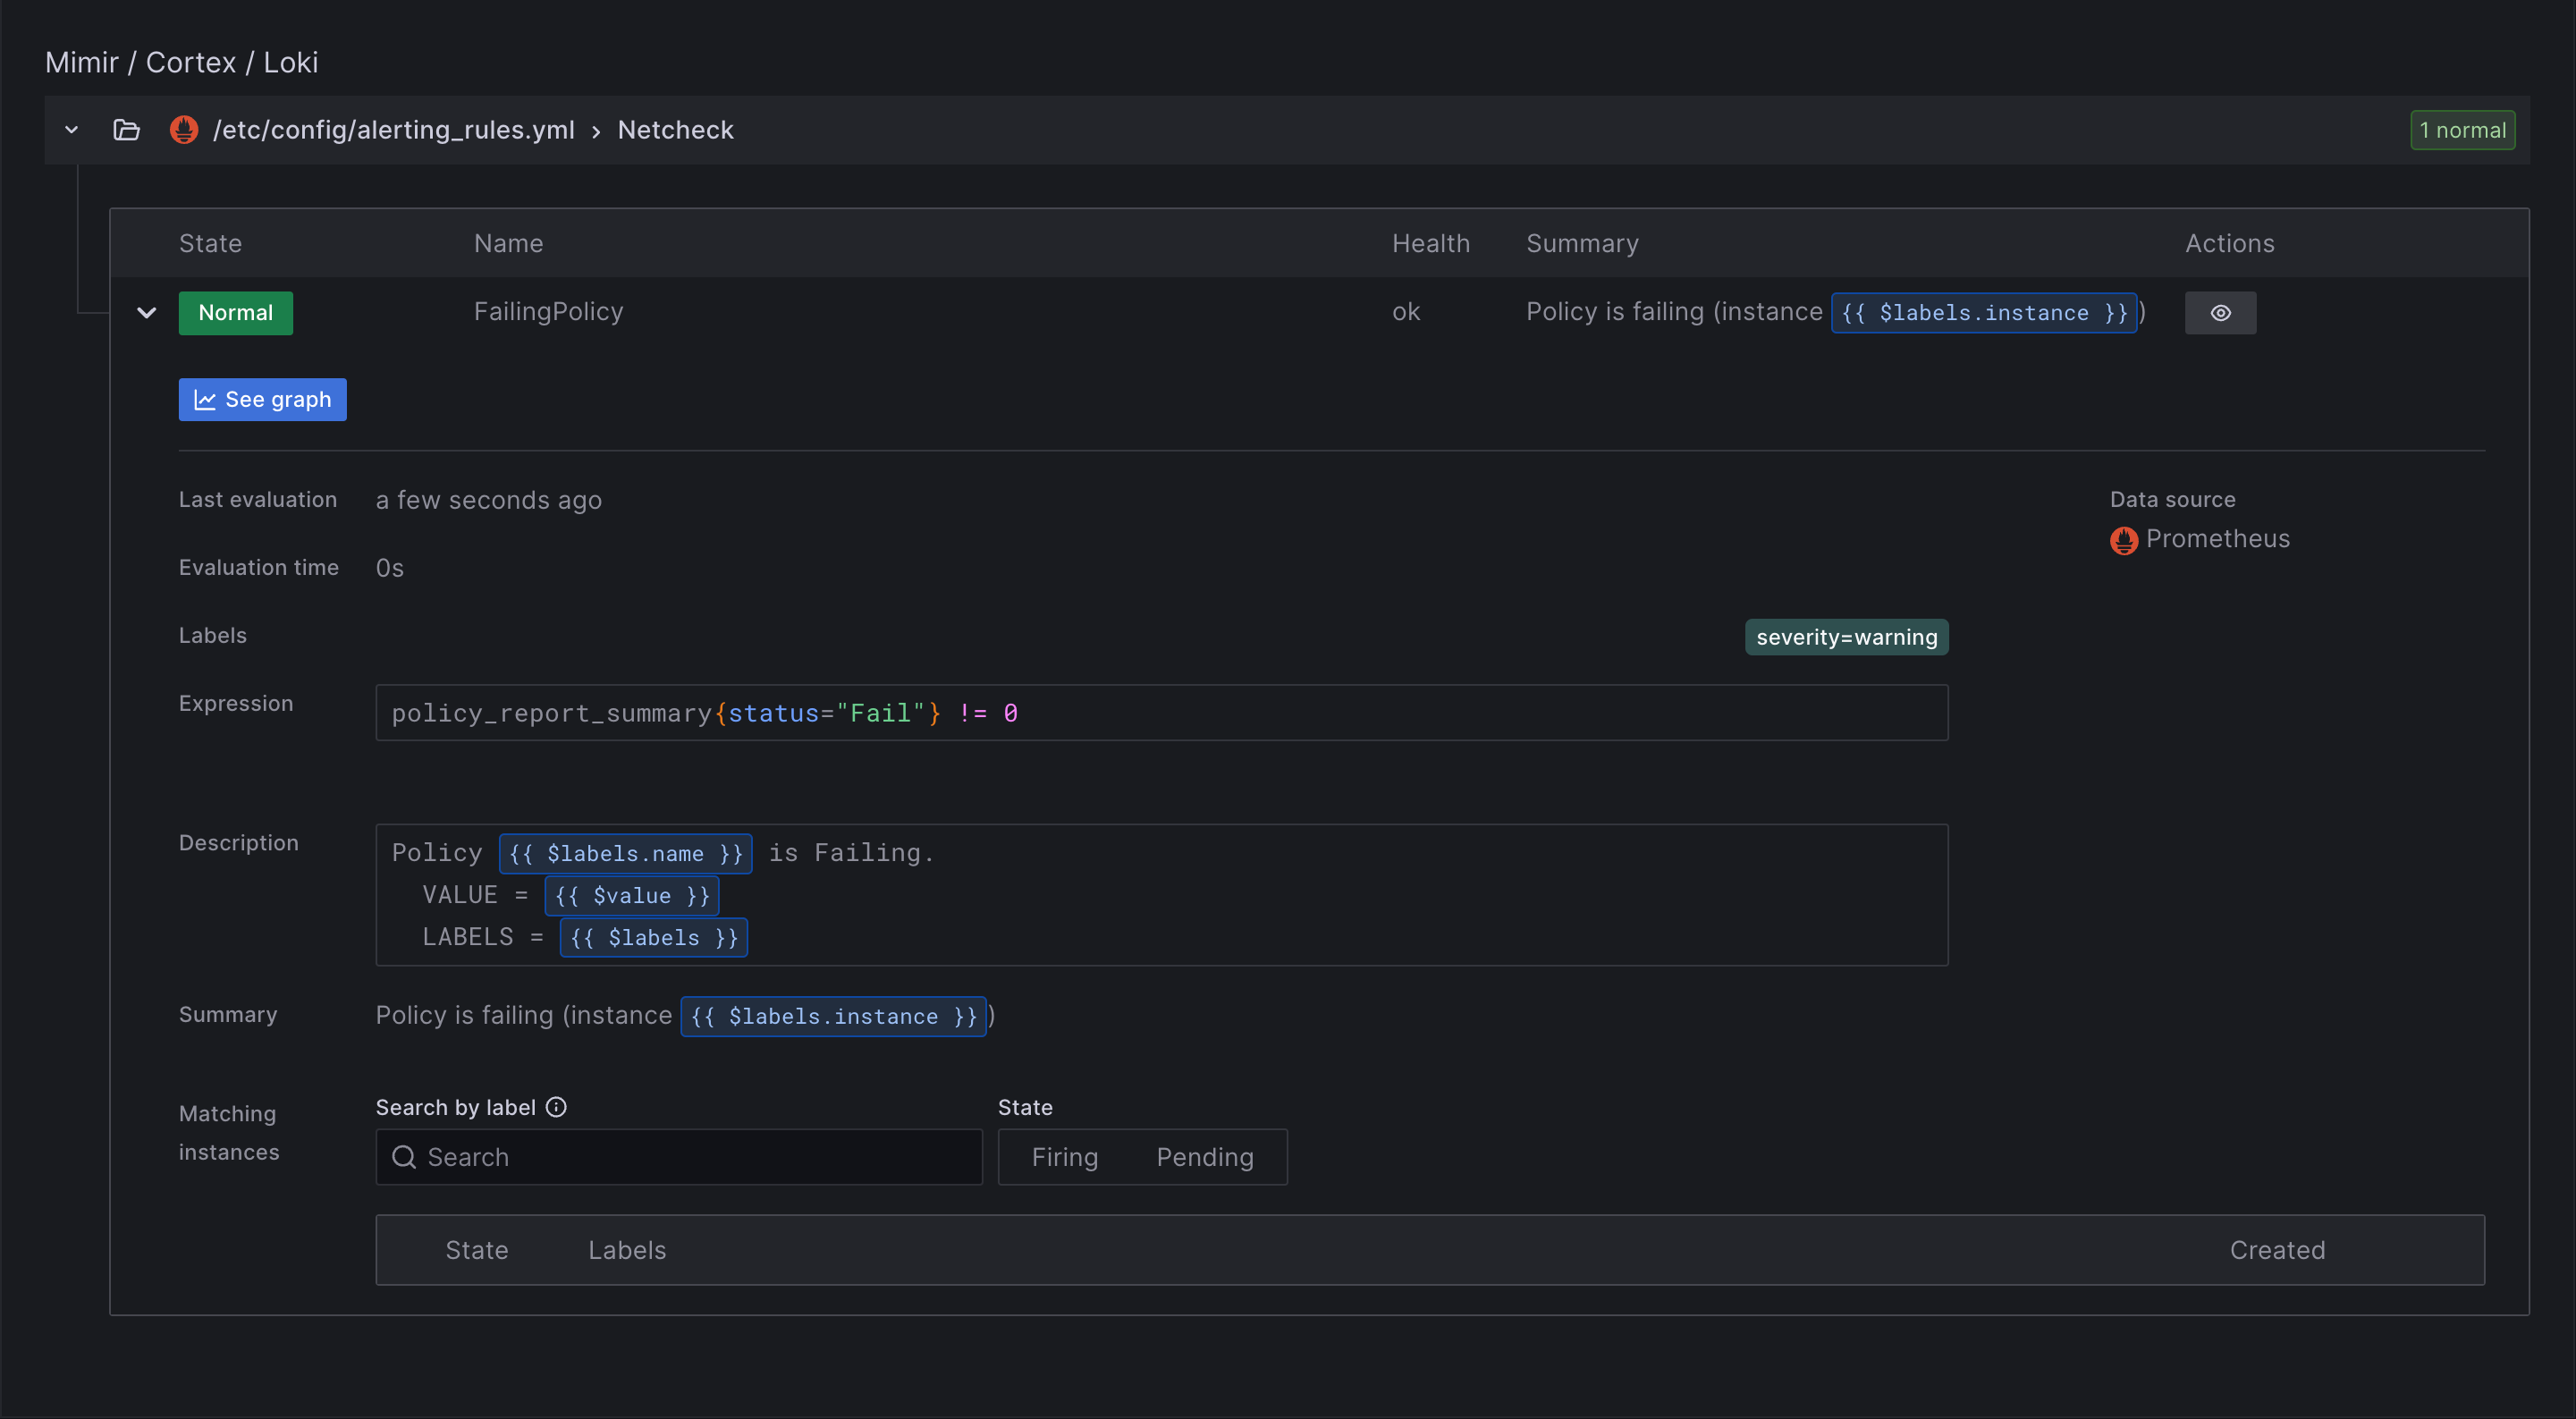
- alert: FailingPolicy
expr: policy_report_summary{status='Fail'} != 0
for: 1m
labels:
severity: warning
annotations:
summary: Policy is failing (instance {{ $labels.instance }})
description: "Policy {{ $labels.name }} is Failing.\n VALUE = {{ $value }}\n LABELS = {{ $labels }}"
This configuration defines an alerting rule FailingPolicy. The rule triggers a warning alert when any policy reports a failure status. The alert includes details about the failing policy, its value, and associated labels.
Configure Alerting in Grafana
Grafana can visualize the alerts generated by Prometheus and also send notifications through various channels such as email, Slack, or PagerDuty. Grafana alert can be configured manually via the UI, or via a configuration file.
Configure Alerting via UI
- Access the Grafana UI
- In the Grafana UI, click on the
Alertingmenu item on the left sidebar, then click onNotification channels. - Click on the
Add channelbutton and configure your preferred notification channel. Provide the necessary details such as API key, URL, or email address, depending on the chosen notification method. - Save the notification channel.
- Navigate to the dashboard where you want to configure the alert, or create a new dashboard with the required panels.
- Click on the panel title and select
Edit. - Click on the
Alerttab and configure the alert conditions based on the desired metrics and thresholds. Select the notification channel.
Configure Alerting via Configuration File
This example configuration sets up Alertmanager to send alerts to a Slack channel when a policy is failing.
alertmanagerFiles:
  alertmanager.yml:
    global:
      slack_api_url: ''

    route:
      receiver: 'slack-notifications'

    receivers:
      - name: 'slack-notifications'
        slack_configs:
          - channel: '#test-notifications'
            send_resolved: true
            title: |-
             Policy Failing [{{ .Status | toUpper }}{{ if eq .Status "firing" }}:{{ .Alerts.Firing | len }}{{ end }}] {{ .CommonLabels.alertname }} for {{ .CommonLabels.namespace }}
            text: >-
             {{ range .Alerts -}}
             *Alert:* {{ .Annotations.title }}{{ if .Labels.severity }} - `{{ .Labels.severity }}`{{ end }}

             *Description:* {{ .Annotations.description }}

             *Details:*
               {{ range .Labels.SortedPairs }} • *{{ .Name }}:* `{{ .Value }}`
               {{ end }}
             {{ end }}